Where does the traffic go?
Who is eating your disk?

ltop finds the process eating your bandwidth or disk — per process, per connection, per LAN peer — in one btop-style screen.

A terminal monitor for software and game developers, sysadmins and enthusiasts. Runs without root; an optional eBPF helper adds exact TCP and UDP byte accounting.

Crates.io CI License Platforms
quick install
$ brew install uMaj35ty/ltop/ltop # macOS & Linux · prebuilt
$ cargo install ltop # from source · Rust stable
$ # or tarballs (x86_64/aarch64): github.com/uMaj35ty/ltop/releases
linux · optional eBPF accounting (per-process & per-connection bytes)
$ sudo cp ltop-bpf /usr/local/bin/ # from the same release
$ sudo cp ltop-bpf.service /etc/systemd/system/
$ sudo systemctl enable --now ltop-bpf
  ltop — omarchy — wlp5s0 — refresh 1.0s+
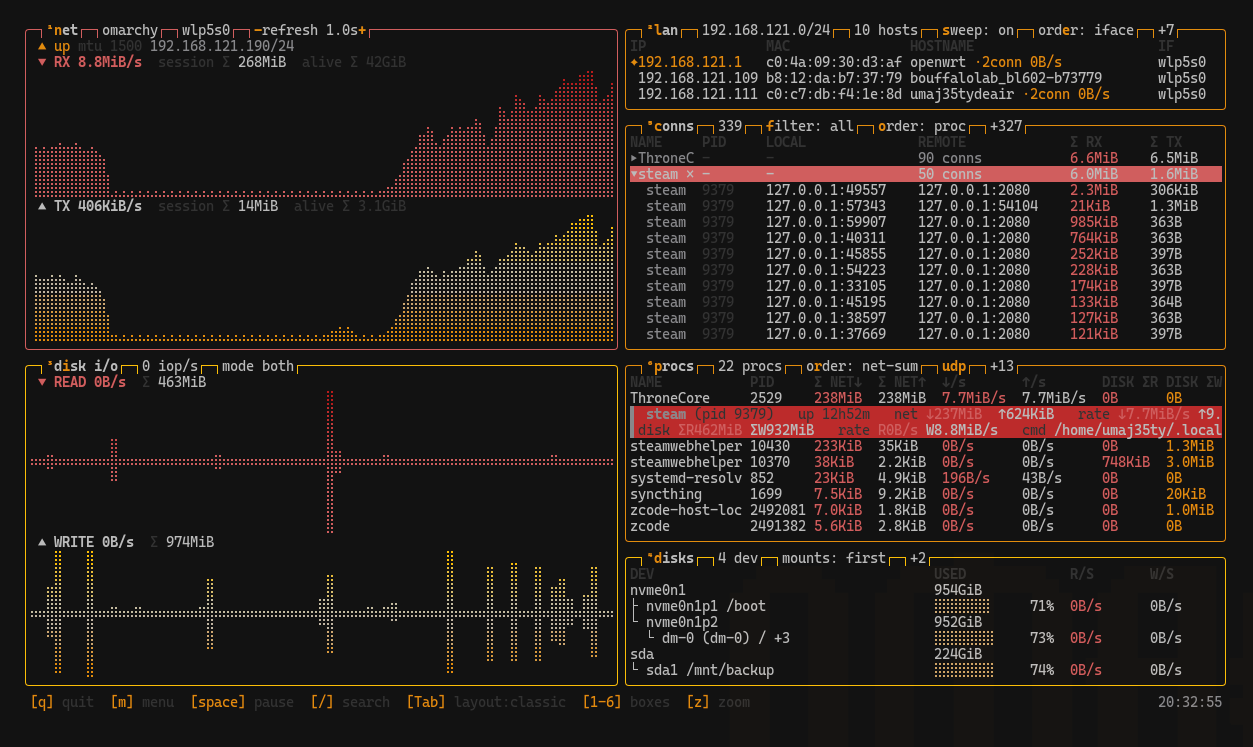
ltop classic layout mid Steam download: NET charts climbing to 8.8 MiB/s, LAN neighbours, connections grouped by process (steam x50 highlighted), per-process totals and the disk tree
The classic layout, live: a Steam download in progress — NET charts climbing, connections grouped per process with group Σ, session-cumulative per-process network + disk, and the physical disk tree with capacity bars.

Features

Six boxes, one job each. Everything on screen is also machine-readable — ltop --json emits the same data as a versioned schema.

▣Six boxes, one job each

NET charts per-NIC throughput; DISK I/O plus a device tree with capacity bars; CONNS lists every socket with live per-connection B/s and totals; PROCS keeps per-process network (TCP+UDP) and disk totals for the whole session — exited processes stay on screen, grayed out, relaunchable with one key.

◉eBPF accounting: TCP and UDP

The kernel exposes no per-socket UDP counters, and sampling misses short-lived connections. The optional root helper ltop-bpf counts bytes at the send/recv syscalls (v4+v6), per pid and per socket inode; the unprivileged TUI diffs a 1-second snapshot. Without the helper, everything else keeps working.

⌬Made for AI agents

ltop --json / --schema for one-shot questions; ltop watch records a window headlessly and ltop report --json returns exact sums and peaks — a 10-minute window costs ~1k tokens instead of ~40k. Agent skill included.

⌂LAN neighbours with traffic

Passive ARP plus a periodic UDP knock finds devices on your subnet (IP, MAC, mDNS hostname, gateway flag). Each neighbour shows its live connection count, rate and bytes — enter pins it and filters CONNS to that peer.

◐72 btop themes, Omarchy follow

Any btop theme file loads as-is; 72 are built in and switchable at runtime. On Omarchy ltop follows the desktop theme, and --follow-theme re-colors it while running. UI in English or Chinese (lang = zh).

⭓Linux + macOS, no root

x86_64 and aarch64; prebuilt for glibc 2.35+. The TUI runs unprivileged; macOS reads native sources (nettop, IOKit, route socket). Verified per release in QEMU/KVM on five distributions — SELinux enforcing included — and on Apple Silicon hardware.

Quick start

From zero to full detail in three commands. The footer always shows the current keys; m → help has the full table.

1

Install

Prebuilt via Homebrew, source via cargo, or release tarballs — all channels.

$ brew install uMaj35ty/ltop/ltop

On macOS 27? Run ltop lan-setup once — real MAC addresses in the LAN/NET boxes (per-user agent, no root).

2

Run — and press these

Tab layouts · / search · enter detail panel · pcl focus a box · z zoom · 1–6 toggle boxes · space pause · m menu.

$ ltop

The full TUI tour →

3

Optional: exact byte accounting

Linux only; adds per-process/per-connection UDP and closes the short-lived-connection gap.

$ sudo systemctl enable --now ltop-bpf

How the helper works →

★

For agents: watch, then report

Record a window headlessly, get exact per-process/per-connection sums and peaks as ~2 KB of JSON — ~97% fewer tokens than polling.

$ ltop watch --duration 10m --proc chrome
$ ltop report <file> --json  # ~1k tokens

The AI workflow →

Roadmap

What shipped, what's next. Details in the CHANGELOG.

✓ SHIPPED

  • 0.1.0First public release — x86_64 Linux
  • 0.2.0–0.2.1Cross-platform — dual-arch eBPF (aarch64 Linux) and native macOS (nettop, IOKit, route socket), Homebrew distribution
  • 0.2.2–0.2.3Polish + AI-friendly surface — --json/--schema, agent skill
  • 0.2.4Headless watch + report — exact window summaries, ~97% fewer tokens
  • 0.2.5–0.2.6Docs site (you're here) + 72-theme library, detail-panel mouse support, coupled graph scaling
  • 0.2.7–0.2.8UX & resilience — grouped bilingual settings, CJK-safe popups, mac idle resilience, spike-damped charts
  • 0.2.9Network & security audit across all four release targets
  • 0.2.10–0.2.11Real MAC addresses on macOS (ltop lan-setup), streaming report, lossless-WebP docs, AtomGit mirror
  • 0.2.12Theme visibility — WCAG dim floor and theme-derived selection/expansion contrast across all 72 themes, eBPF stack on aya 0.16, versioned helper snapshots
  • 0.2.13Disks browsing — btop-style scrollbar and keyboard access, macOS lists mounted volumes with per-volume used bytes (getattrlist), pid-reuse guards on kill/restart, cargo-deny + rustfmt CI gates, 2.0 s first-run refresh

→ NEXT

  • 0.2.xongoing — bug fixes, tech debt and QoL ride the stable line
  • 0.3fleet (beta branch open) — SSH aggregation of many machines: one terminal watches the whole LAN, nodes install nothing new
  • 0.4ltop mcp — a stdio JSON-RPC server wrapping the JSON surfaces for agents