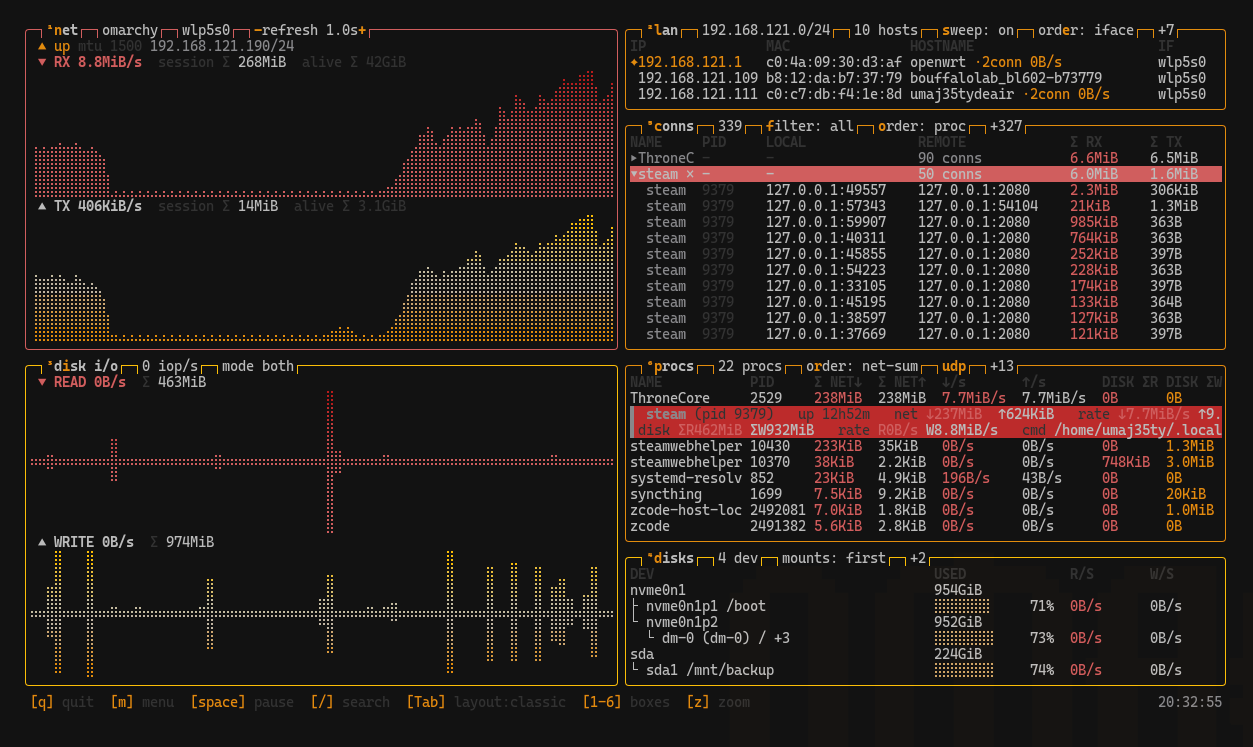
Classic layout, live — Tab cycle #1
A Steam download in progress: NET charts climbing (RX 8.8MiB/s), LAN neighbours online, CONNS folded per process (steam ×50, group Σ highlighted), PROCS with session-cumulative network + disk columns, and the DISKS device tree with capacity bars.
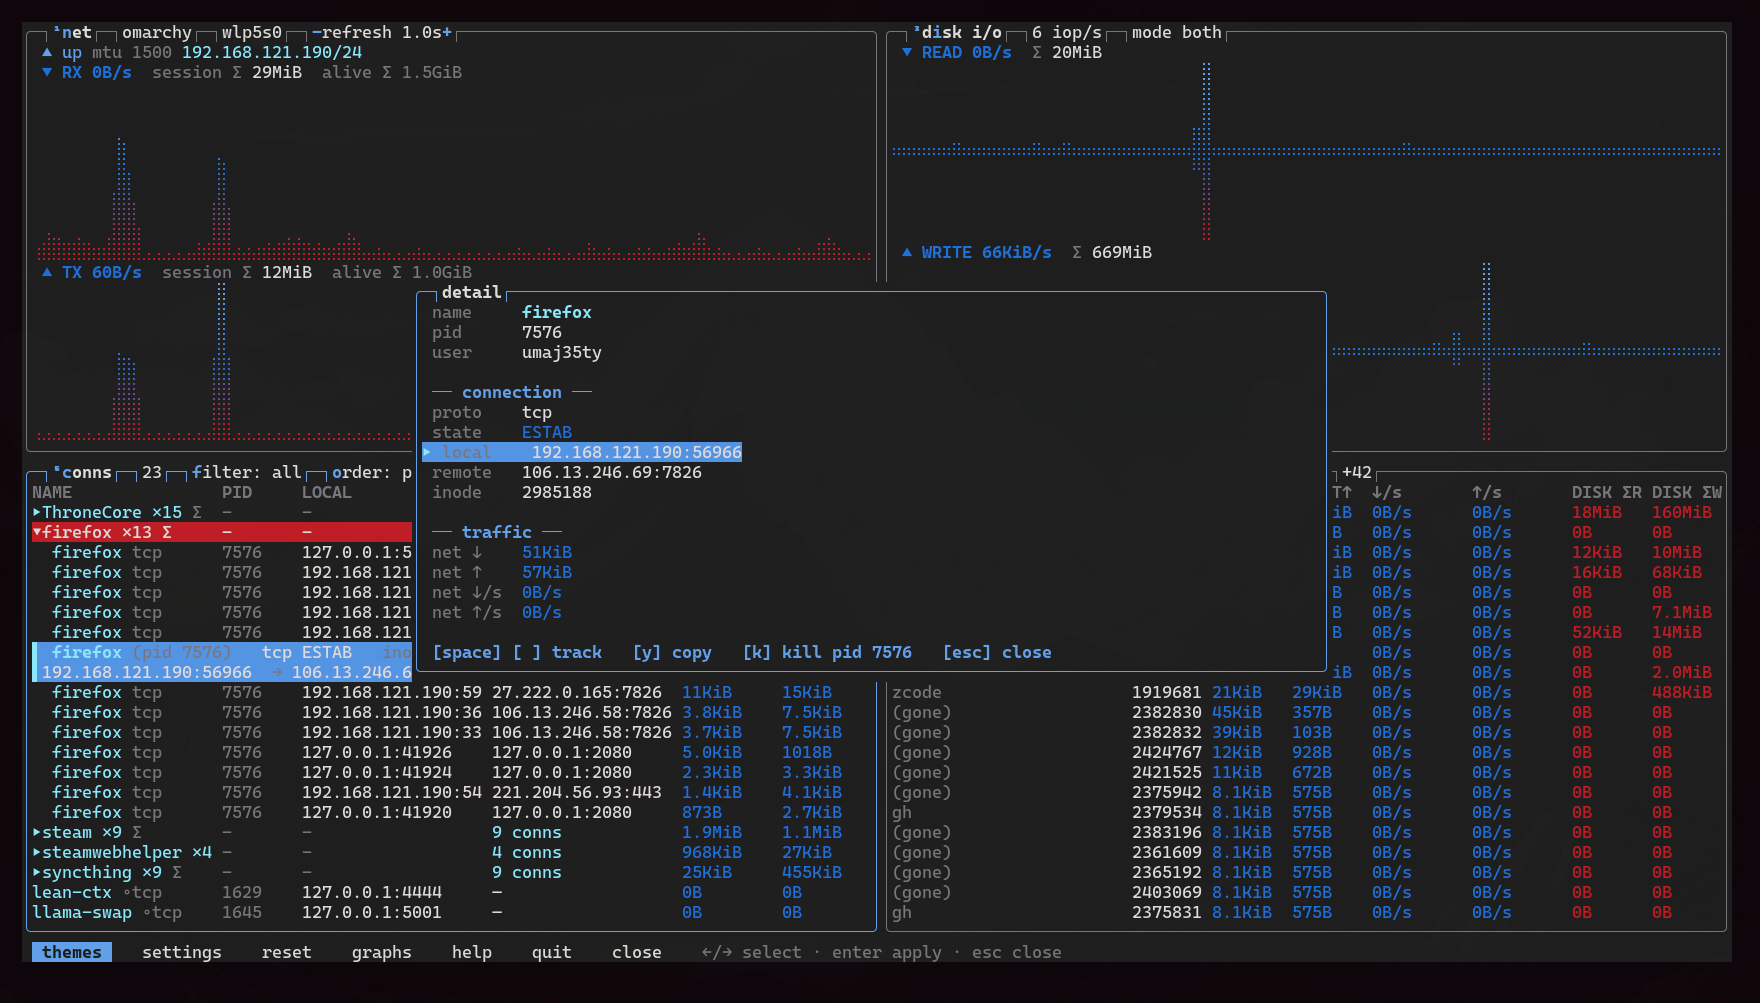
Wide layout, connection detail — enter on any row
A firefox connection open in the detail panel: protocol and state, local/remote endpoints,
inode, traffic Σ and rates. Inside the panel: space/t track-pins the
row, y copies any field (OSC 52 — works over SSH), k kills. Exited
processes keep their totals below (grayed, marked (gone)).
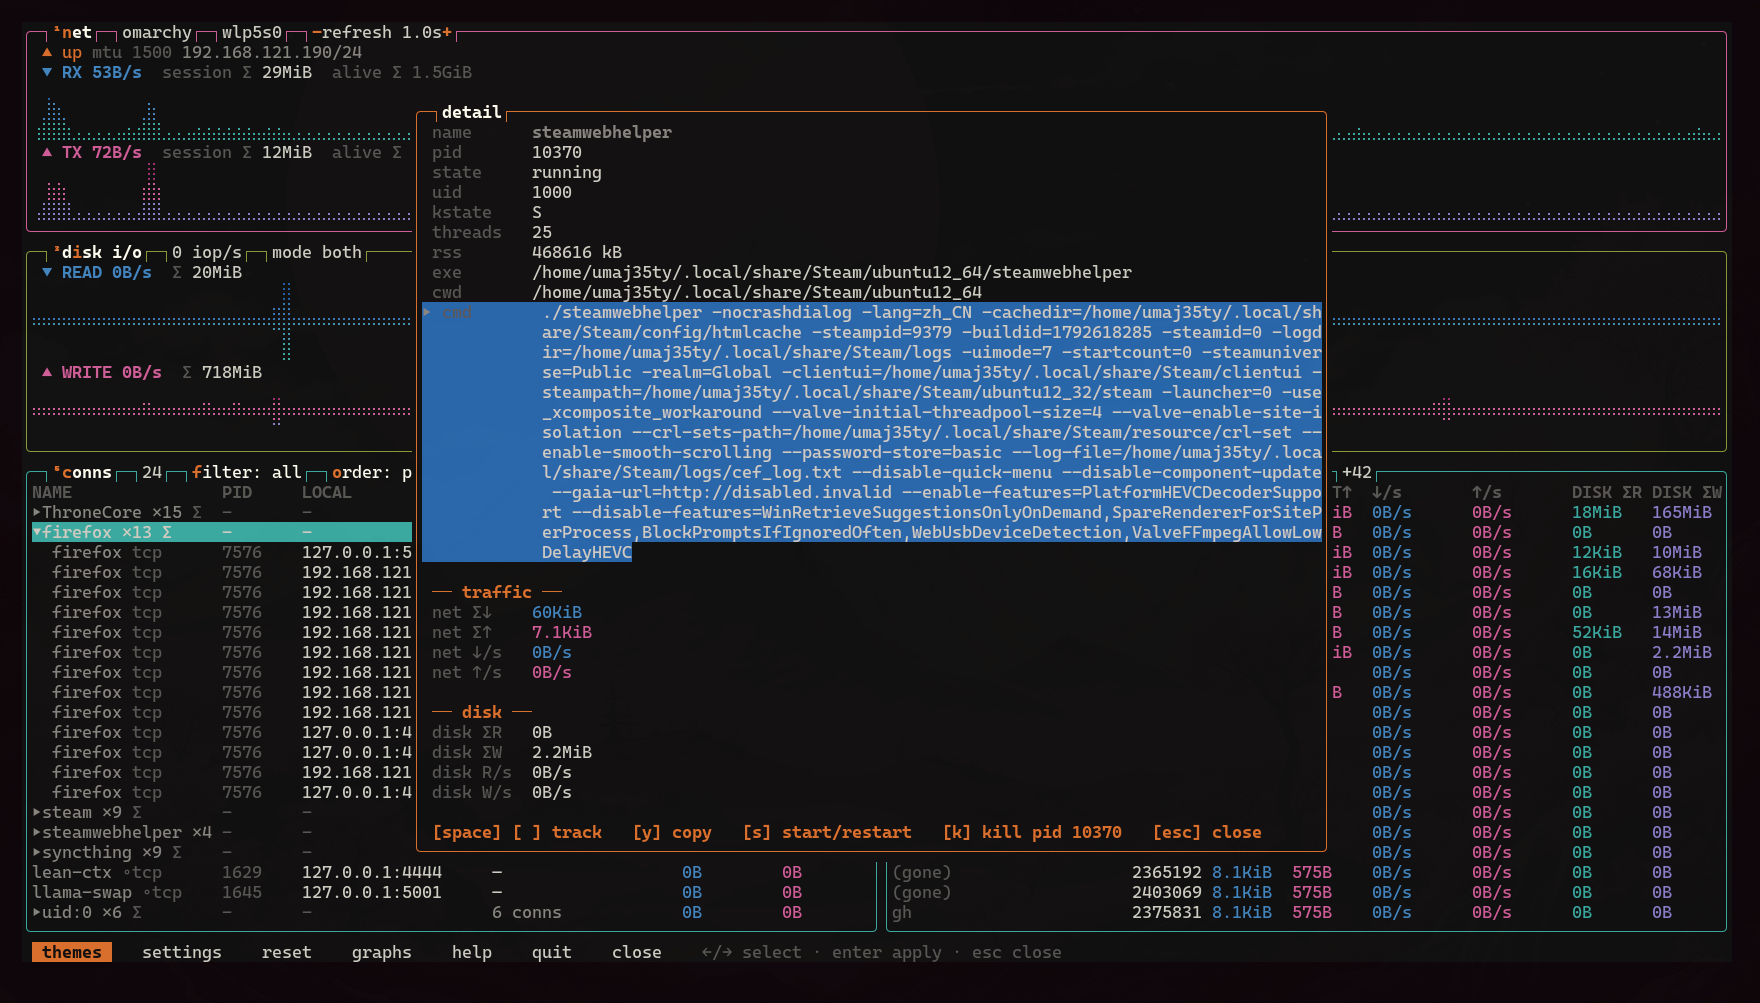
Tall layout, process detail + copy — Tab cycle #3
steamwebhelper open in the detail panel: uid, kernel state, threads, RSS, exe/cwd — and the
full captured command line with the selected segment highlighted for y. Traffic and
disk break-down below, the whole box zoomed over the tall layout.
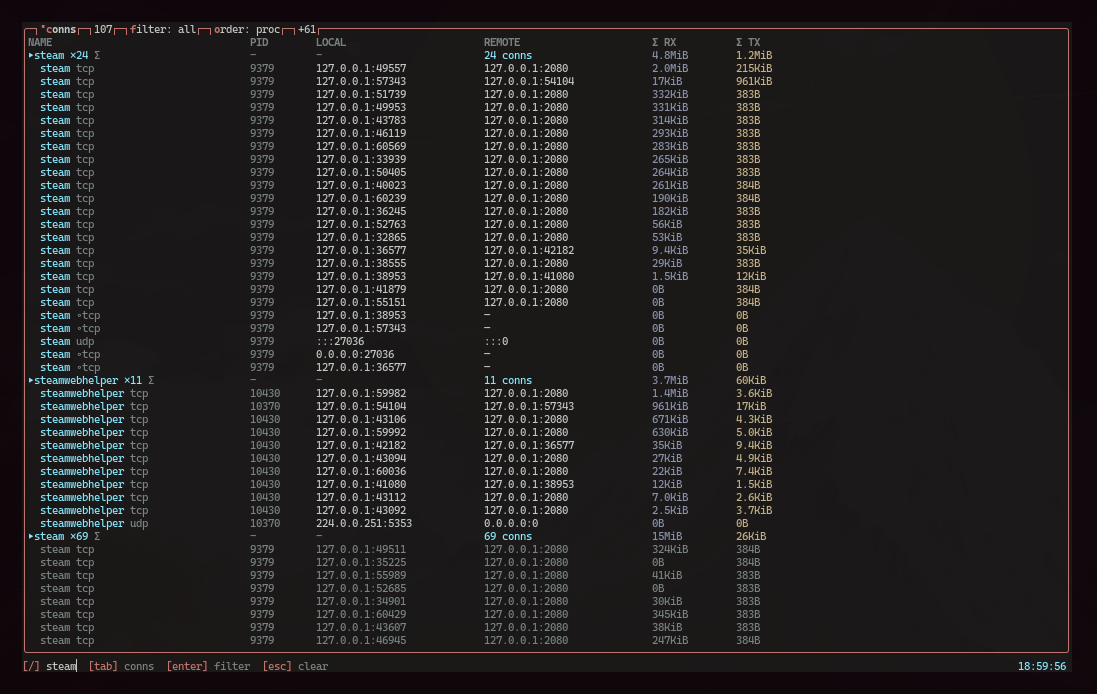
Zoom + search — z and /
CONNS zoomed full-screen (z) with a live search (/ steam, footer
shows the active filter): 107 connections folded into process groups — steam ×24, steamwebhelper
×11, steam ×69 — each group head carrying its Σ, UDP rows tagged and metered by the eBPF helper.
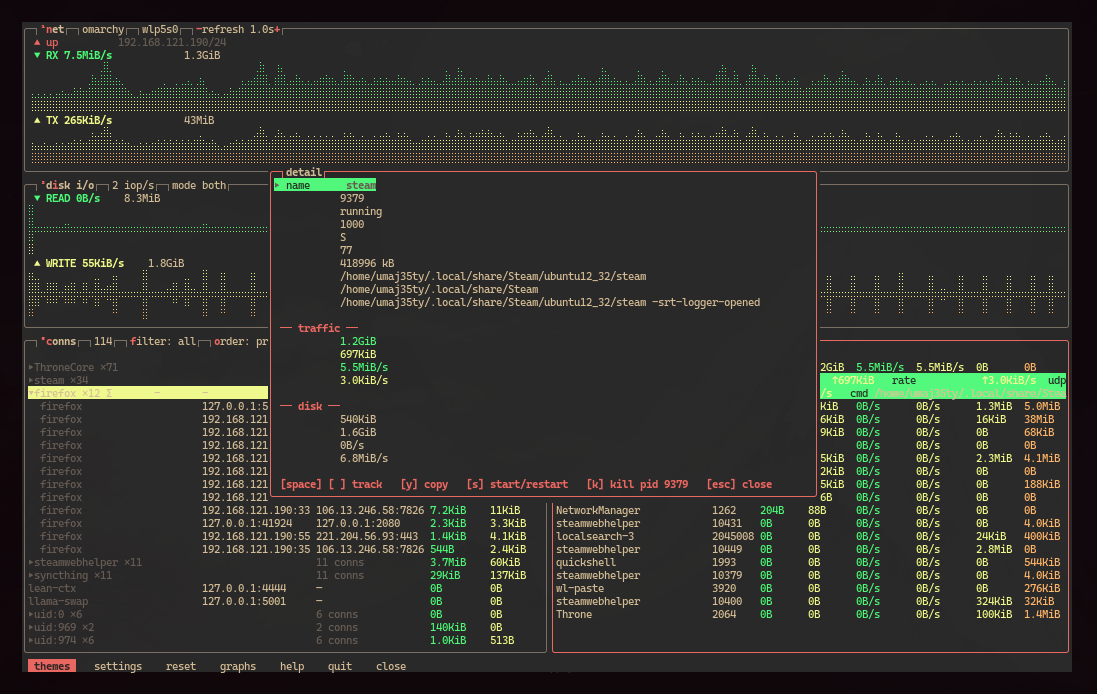
Detail fields, grouped & copyable — ↑↓ and y
The detail panel groups a process's identity, traffic and disk numbers; ↑↓ moves
a field cursor and y copies the selected value to the clipboard (OSC 52, no X11
dependency). The theme menu (m) waits behind it.
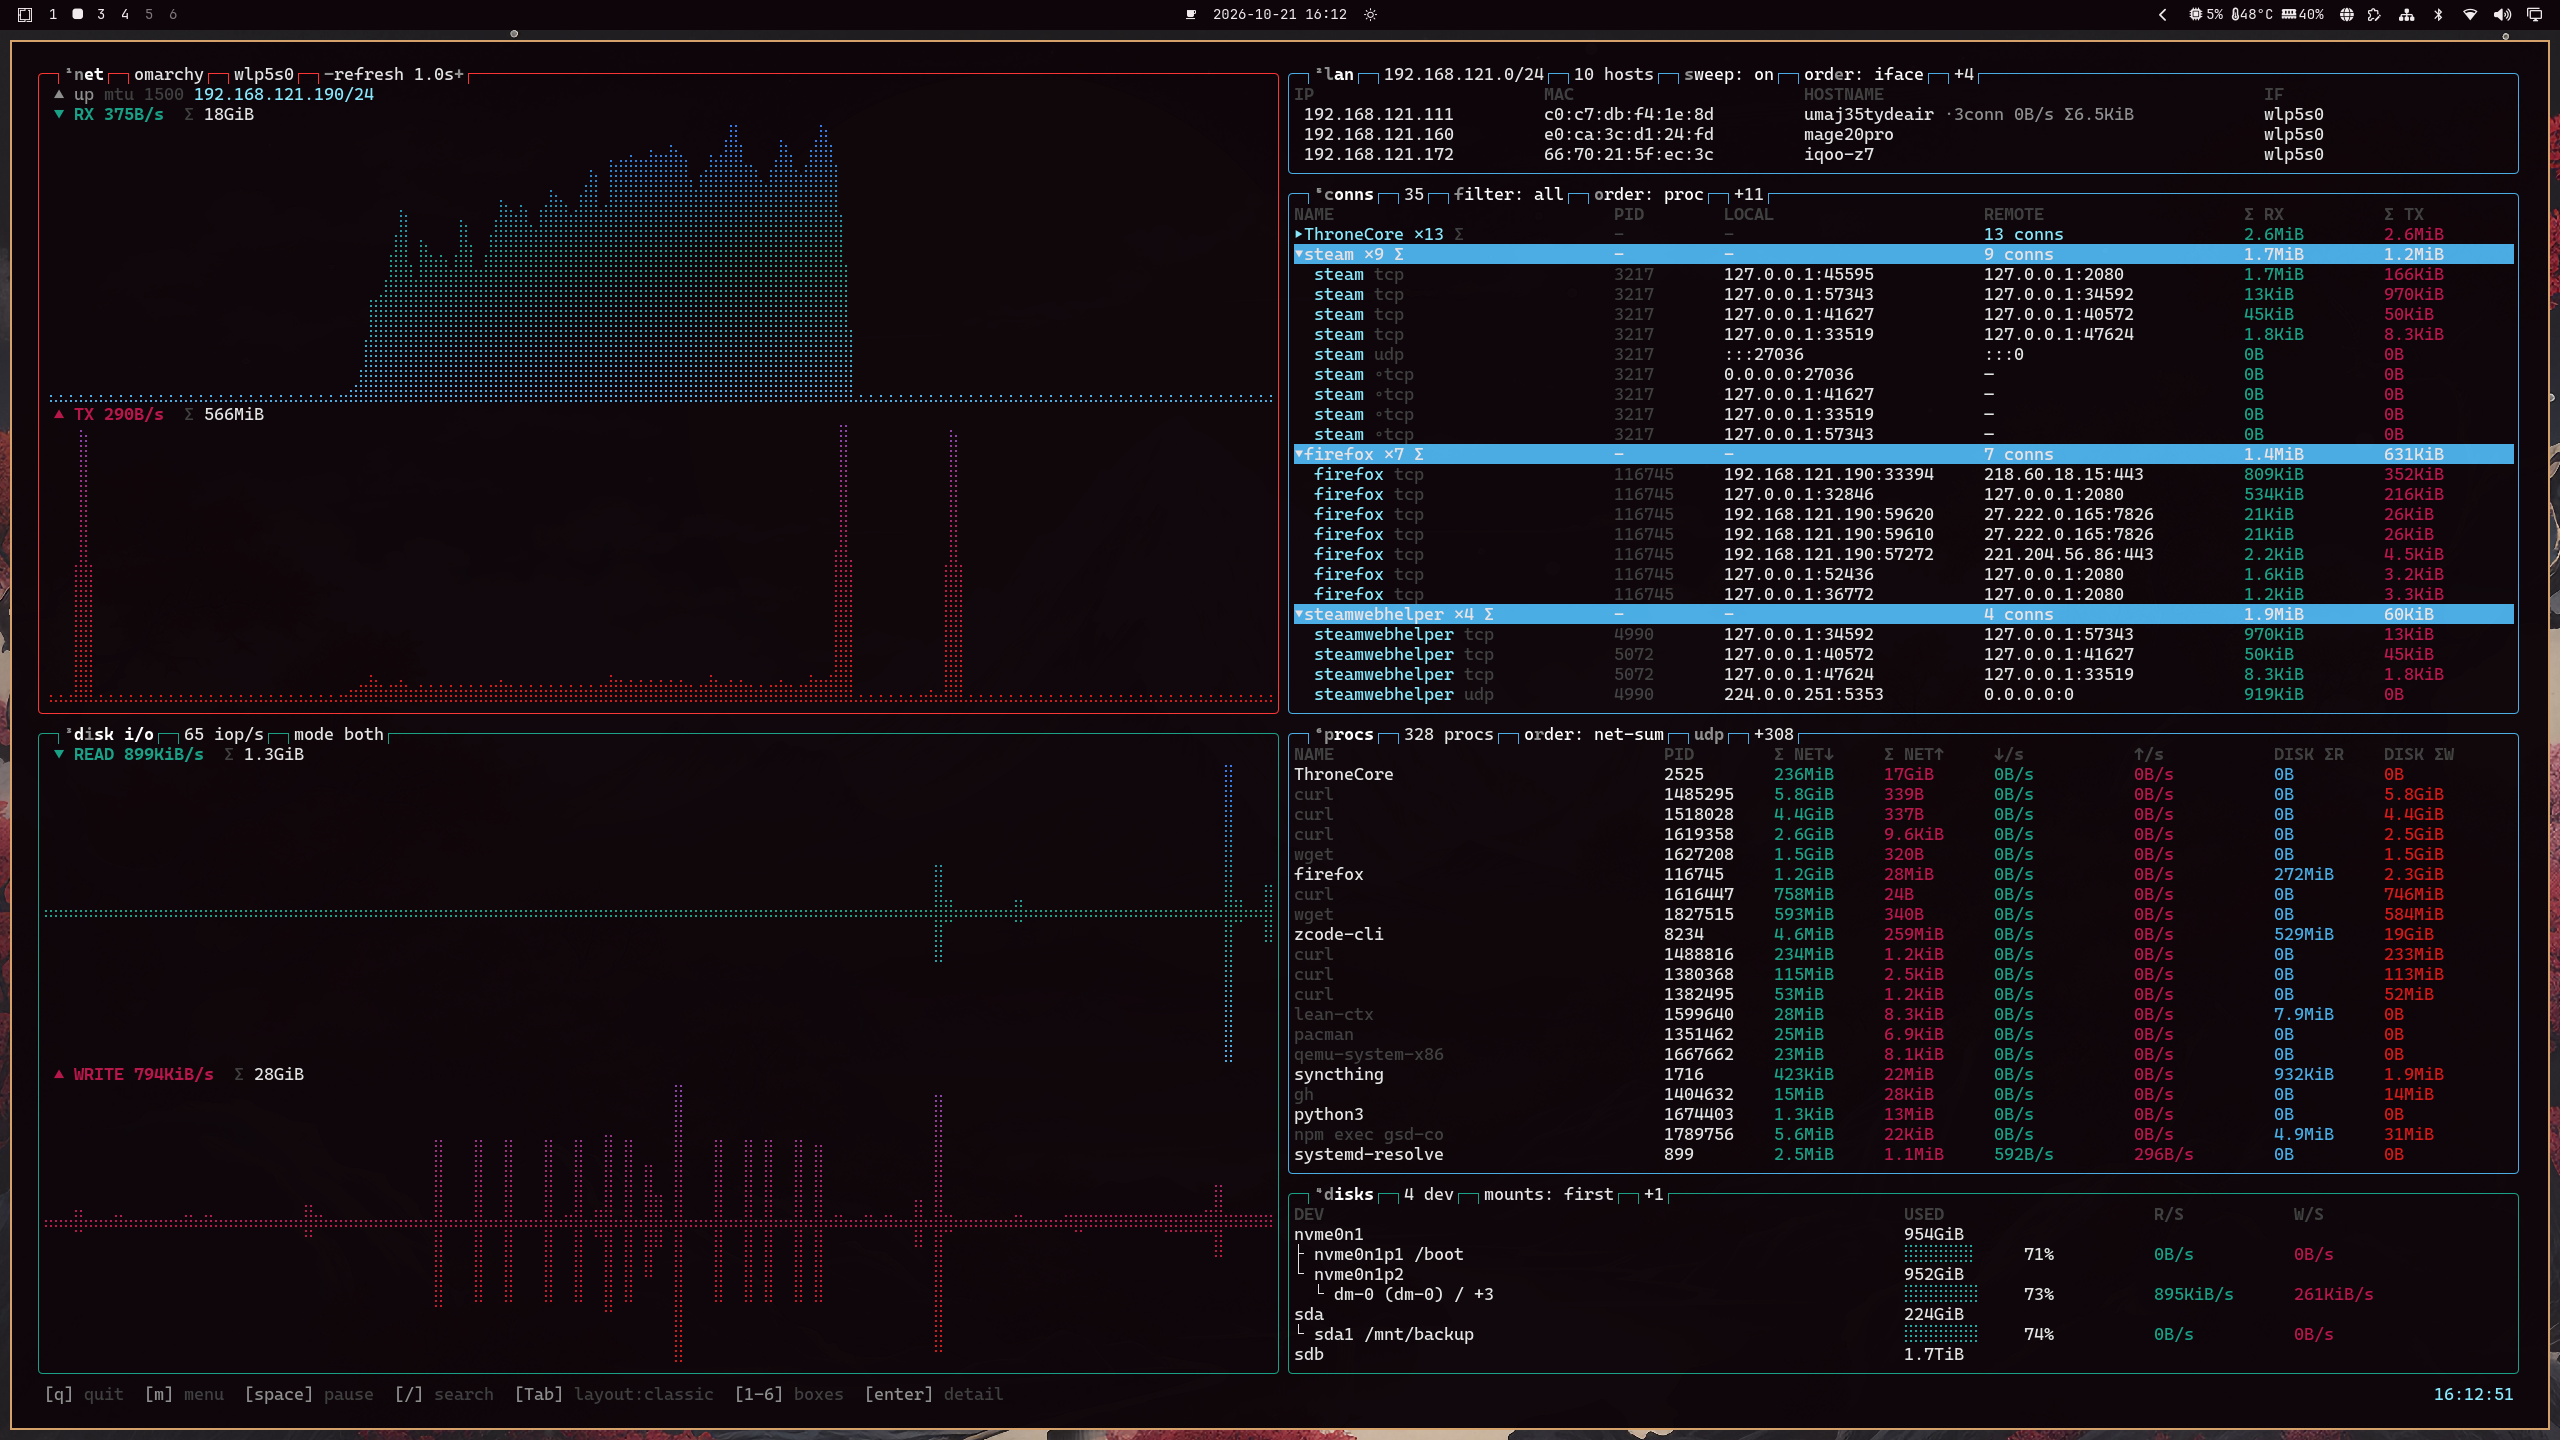
Classic, full width — the six-box overview
Earlier full-width capture: braille throughput charts, LAN neighbours with per-peer traffic, connections grouped with Σ totals, per-process session accounting, the disk tree.
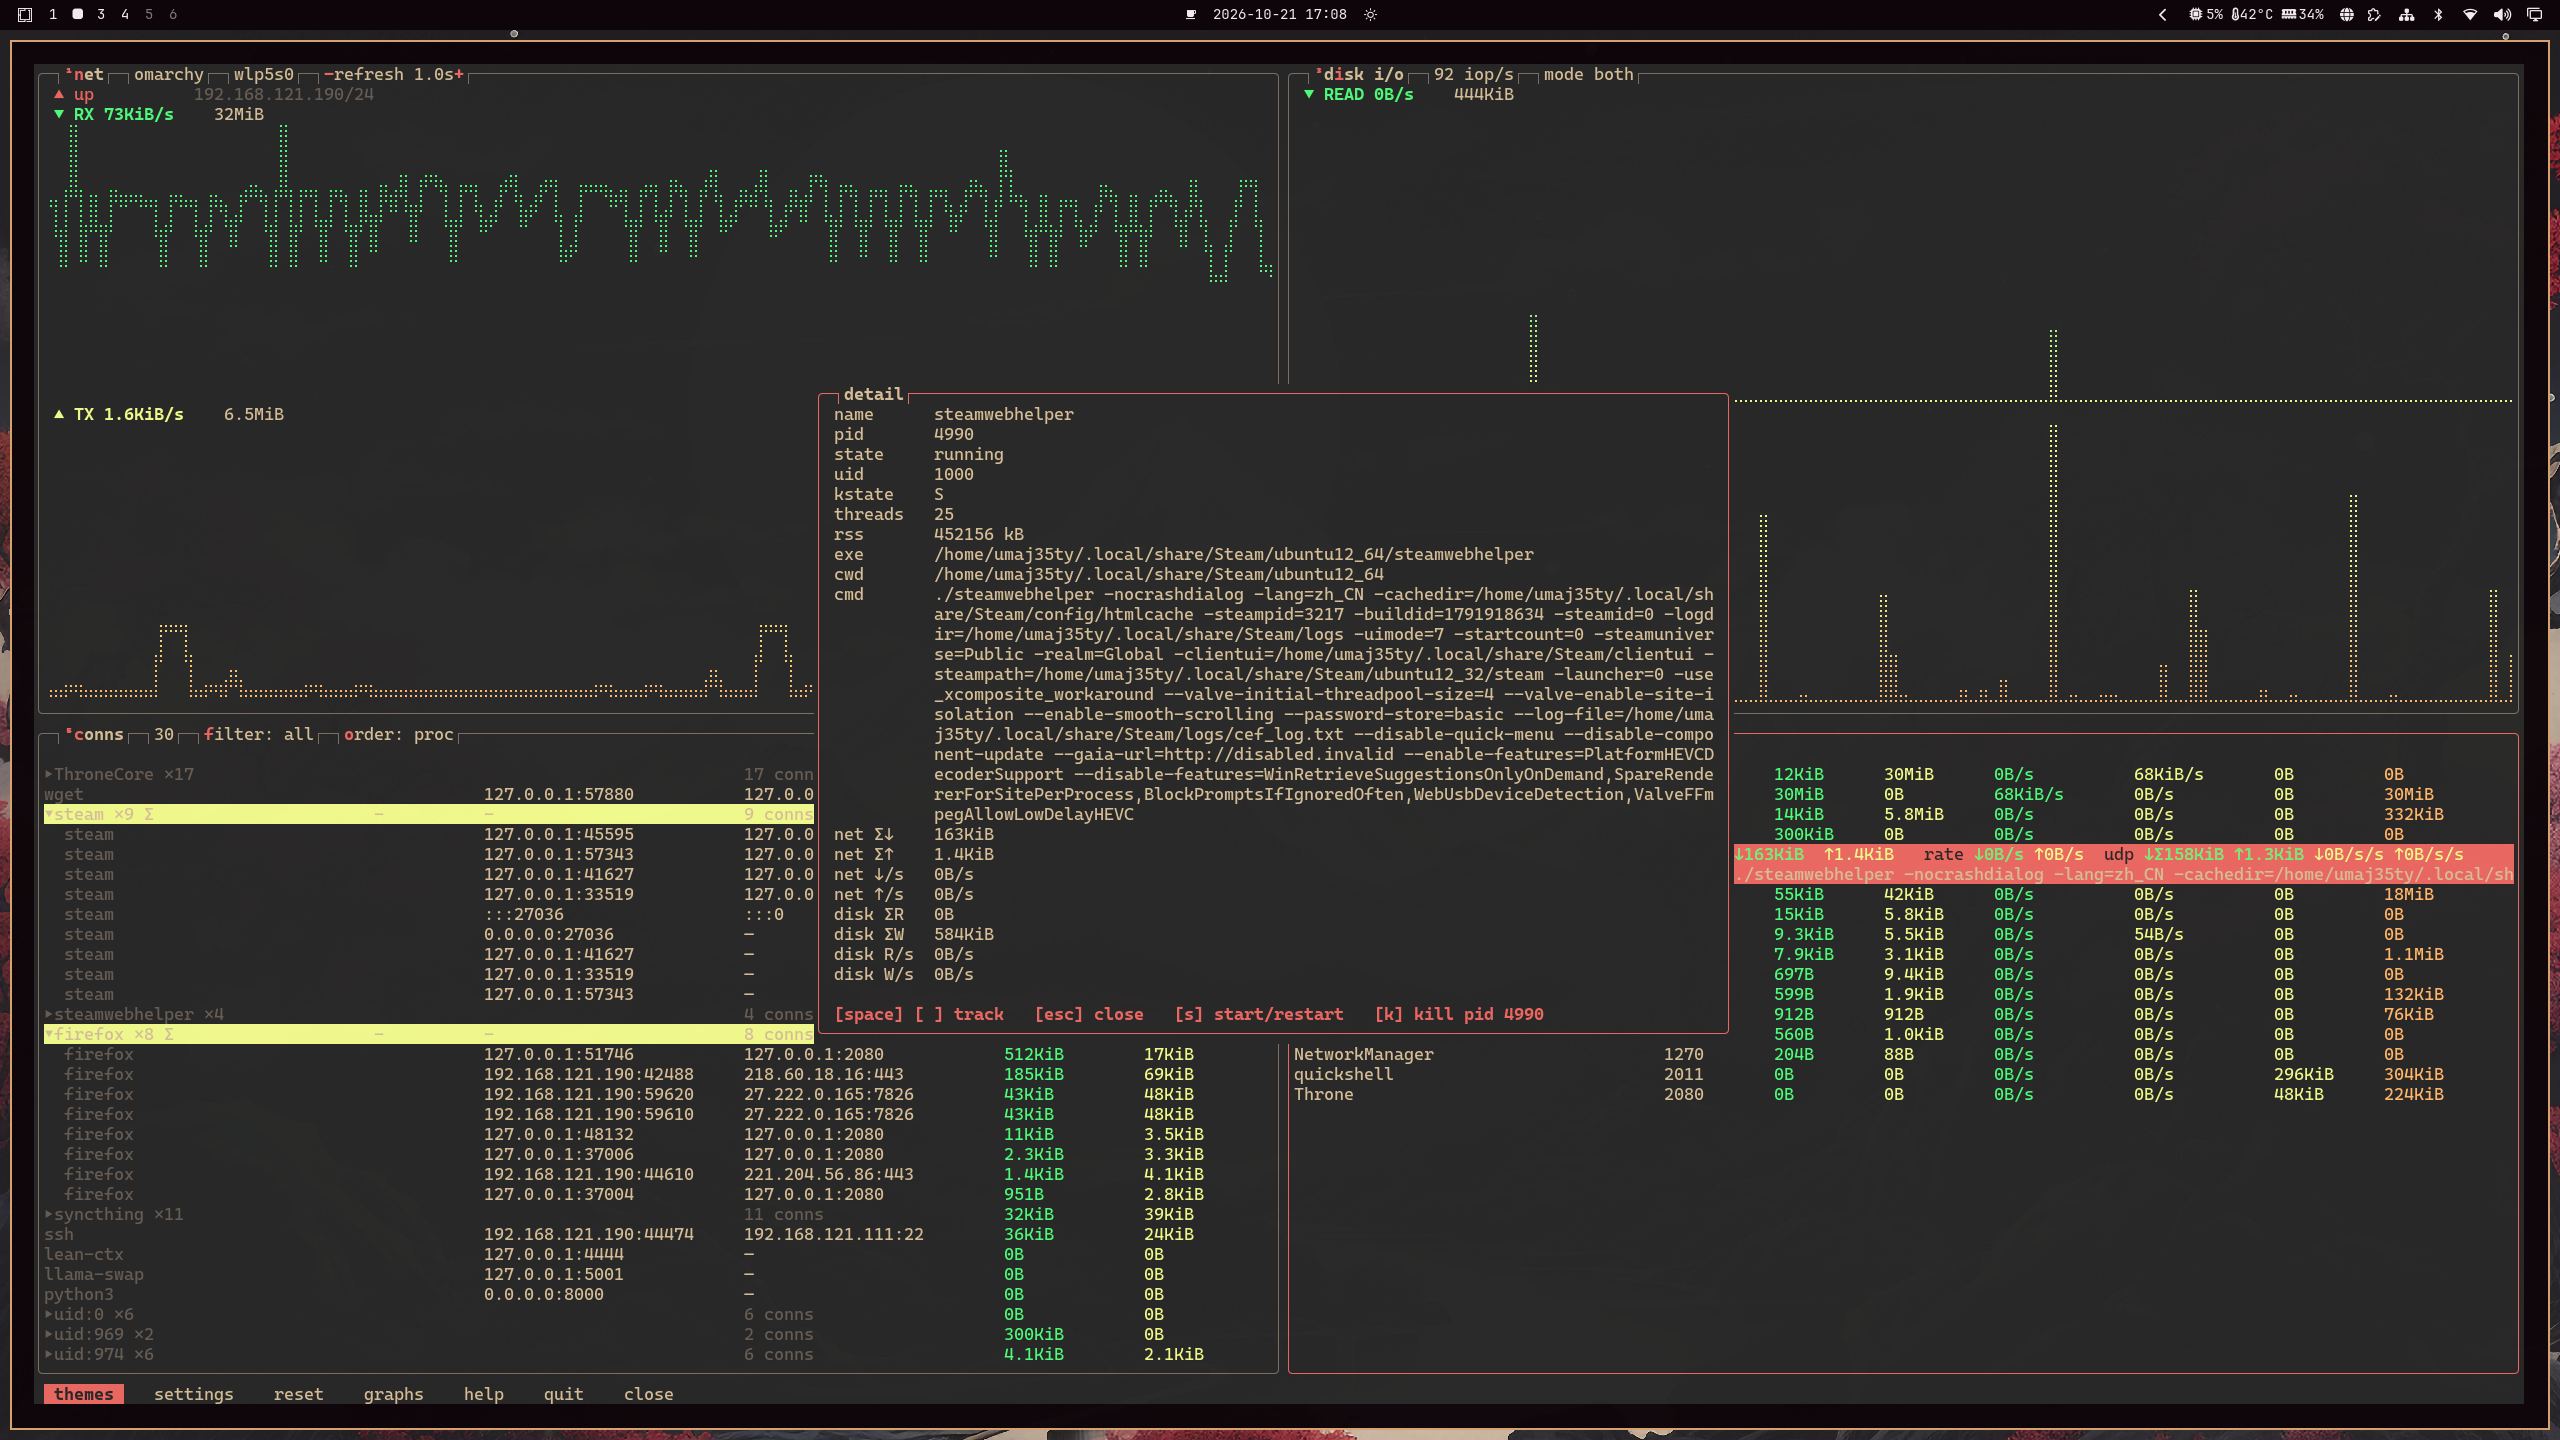
Wide layout, process detail — Tab cycle #2
Charts across the top, tables below — a process open in the detail panel with its full command line, per-connection UDP break-down and the theme menu behind.
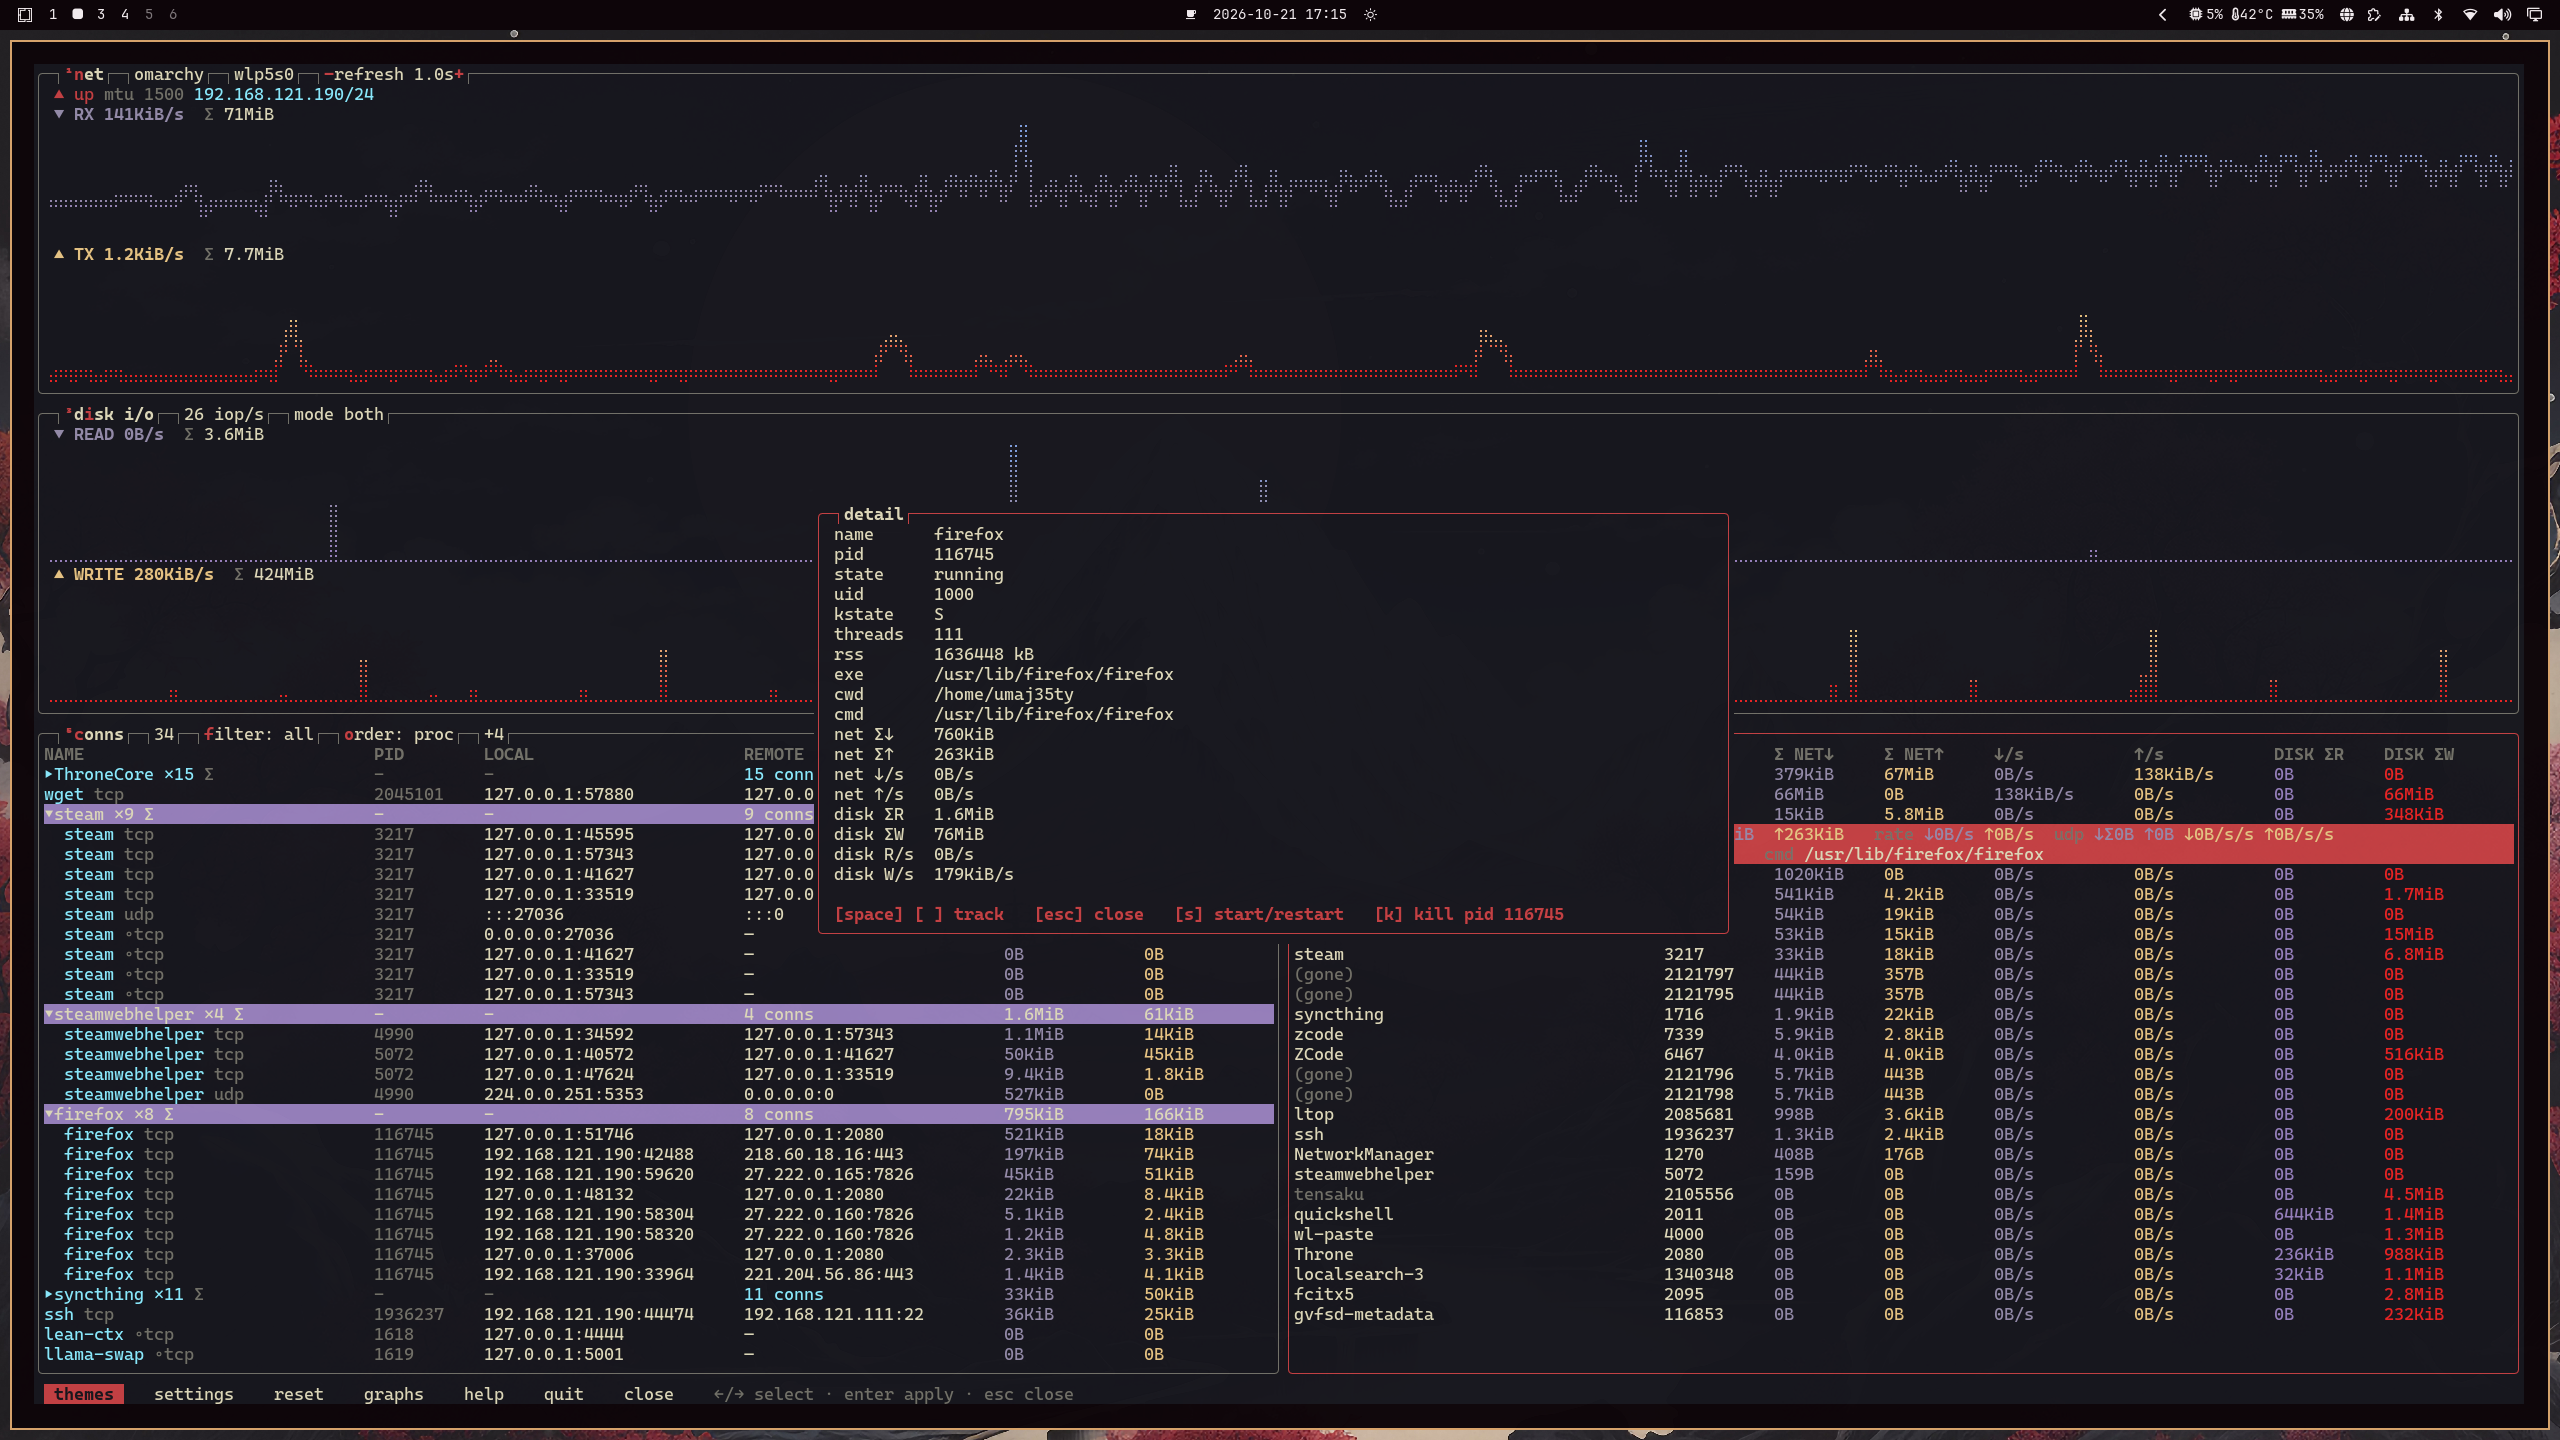
Tall layout, grouped connections
Single column for narrow terminals: CONNS in proc-grouped sort, group heads with totals, a tracked row (yellow) surviving re-sorts.
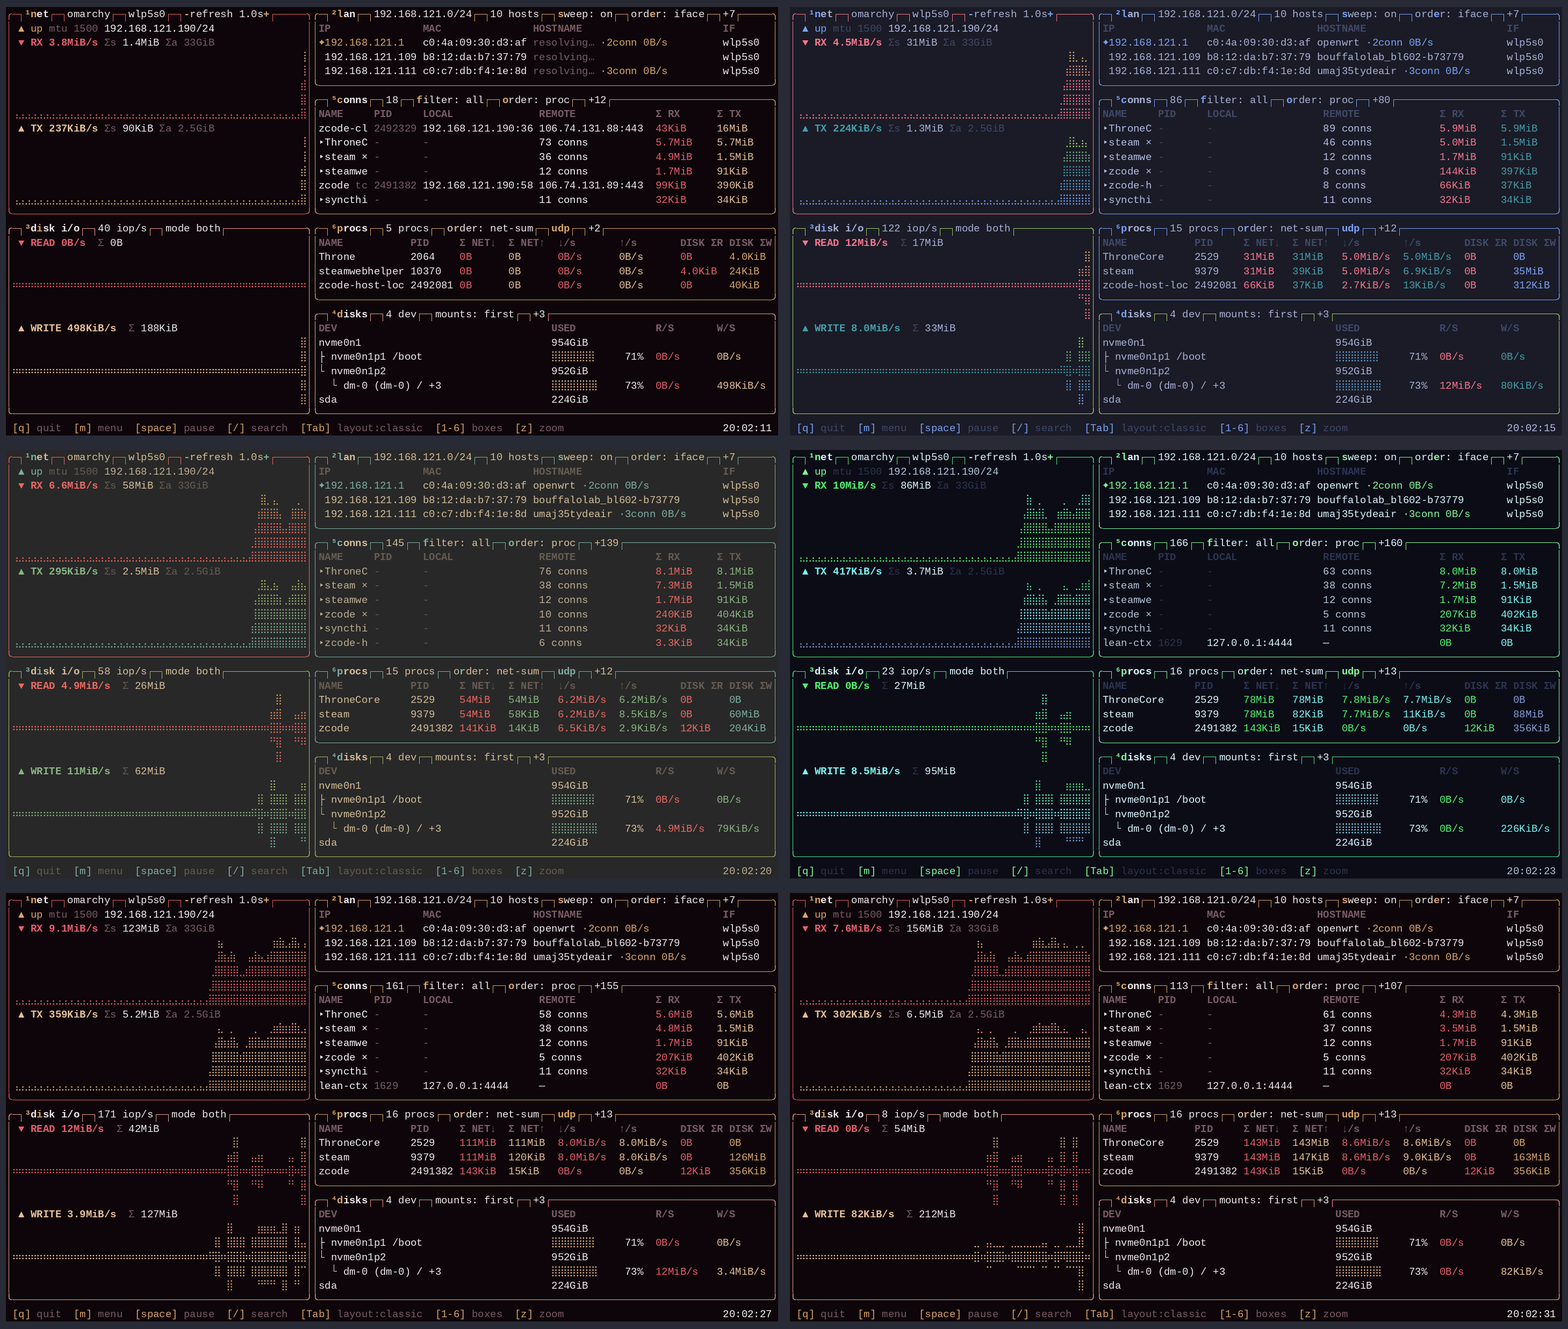
Theme follows the desktop — --follow-theme
Sakura → Tokyo Night → Gruvbox → Hackerman → Sakura, live: with --follow-theme
a running ltop re-colors as the Omarchy desktop theme switches, no restart. Any btop theme
file also loads as-is: ltop --theme ~/my.theme.